A well-designed measurement system is not just a reporting tool; it’s a strategy for keeping a regional coalition mobilized and focused over the long term.
Ecosystem builders need to do three things: establish a baseline that captures the health of innovation networks (not just outputs), construct metrics that demonstrate system integrity end-to-end, and set goals that are ambitious but defensible. Each of these requires teams to think and communicate about their work in a different way.
When they work, investments in economic transformation pay for themselves many times over. But they are still major investments. For Regional Innovation Engines and similar coalitions with catalytic seed funding to succeed in their appropriately lofty ambitions, they need a wide range of organizations to contribute to their efforts over a long period of time.
Regions that have changed their economic trajectories through innovation have made substantial and sustained investments. The State of New York invested over $1.5 billion in semiconductor R&D before Micron selected Syracuse as the site of up to $100 billion worth of semiconductor fabs. The North Carolina Biotechnology Center invested tens of millions of dollars per year for several decades to establish the Research Triangle as a hub of life sciences innovation and manufacturing. The list goes on.
But funding is just one, incomplete measure of the contributions required. Regional leaders building innovation networks need many actors–some on the periphery of innovation-based economic development–to contribute in many other ways. They may need state governments to pass new legislation, or community organizations to provide outreach for training programs, or economic development organizations to work on recruiting firms that fill key gaps in value chains, or community colleges to develop new curricula.
The problem is that none of these actors–in general–are designed or inclined to focus on emerging sectors. States are more likely to pass policies in support of existing sectors that have a voice in the legislature. Community colleges tend to focus on programs with reliable demand from students and companies and can be hesitant to create programs for occupations that are novel or nascent. And economic development organizations are prone to attracting firms that provide bigger ribbon-cutting opportunities.
Metrics, if properly constructed, can help intermediary “hub” organizations like NSF Engines re-orient some of these actors. But this requires creating metrics that don’t just measure the performance of the ecosystem-building organization itself–they must articulate how the organization is part of a vehicle that, with the proper investment, can carry a lot of people to a worthwhile destination. And they must allow this large group of people to pick a route and course-correct along the way.
Fortunately, the metrics many NSF Engines already track can be restructured and extended in ways that exert a much stronger draw on a wider range of funders and implementation partners. To do so, metrics need to accomplish three things:
A region cannot measure its progress if its starting point is not clearly defined. It’s not enough for ecosystem builders to define starting points in terms of innovation outputs but also in terms of the depth and dynamism of networks that produce those outputs.
Ecosystem-building is a distinct goal of NSF Engines for a reason. Imagine two regions, each with equal innovation performance in terms of R&D funding, patents, venture capital attraction, and so forth. If one of those regions achieved that level of performance through the combined efforts of 10 large organizations and another through 100 organizations of varying size, the latter would be far better positioned for future growth. One study found that, holding the number of inventors constant, regions with a mix of large and small R&D labs have much higher innovation productivity (28% increase in spin-out formation) than those with only large or only small labs. In other words, local innovation is affected by whether the “organization of R&D manpower” enables the right interactions among inventors, not just the quantity or quality of inventors.
Ecosystem building organizations should therefore design metrics that allow them to measure progress on the health of innovation networks–especially because these metrics may be leading indicators of changes in innovation output that may take the better part of a decade to emerge.
Chad Shearer, Founder of the consulting firm Denizens and Research Director for the Global Institute on Innovation Districts, shared a replicable method for tracking the extent and quality of innovation networks. He outlined three dimensions of innovation—discovery, invention, and enterprise—and showed how they interact through feedback loops.
Shearer noted that “Twenty years ago, economic developers thought of this as a pipeline—from universities into patenting, to tech transfer, to commercial enterprises. But the field has really evolved. Now we understand this is a system of systems, with discovery, invention, and enterprise linked by feedback loops… when the connections are strong—when knowledge recycles locally—that’s when ecosystems really grow and sustain themselves.”
Shearer described one project he led, Data for Amsterdam, that revealed high levels of local knowledge recycling: discoveries cited in patents, patents commercialized by local startups, and multinational firms funding local research. The region’s innovation strengths were not only in volume but in diversity (ranging from life sciences to industrial automation) and network density—collaborations among universities, firms, and research institutions.
To give a sense of the kind of data that this method can generate, and that can serve as baseline for metrics, Shearer noted that about 42% of new inventions in Amsterdam cited prior local knowledge, either from previously issued patents or from local research articles, and about 17% of venture-backed startups were building on local patents. If an NSF Engine or similar regional coalition increased these figures in the medium-term, they could claim success even if changes in innovation output had not yet materialized.
Recent advances in public data like OpenAlex and Lens, allow regions to map these relationships with unprecedented precision and track how well discoveries are translated into inventions and enterprises, offering a richer way to measure ecosystem performance.
Metrics are often an assemblage of data points that give the impression of whether a system is working or not–whether ideas are becoming growing companies, whether people with innate talents are being equipped to generate those ideas and build wealth–but don’t actually carefully investigate whether that is true. They assume that people know that a given industry’s success matters to the performance of the regional economy as a whole without providing evidence for that.
To more powerfully demonstrate that an innovation ecosystem is performing and contributing meaningfully to regional outcomes that matter to a wide range of stakeholders, metrics need to be assembled in a structure that has both horizontal and vertical integrity.
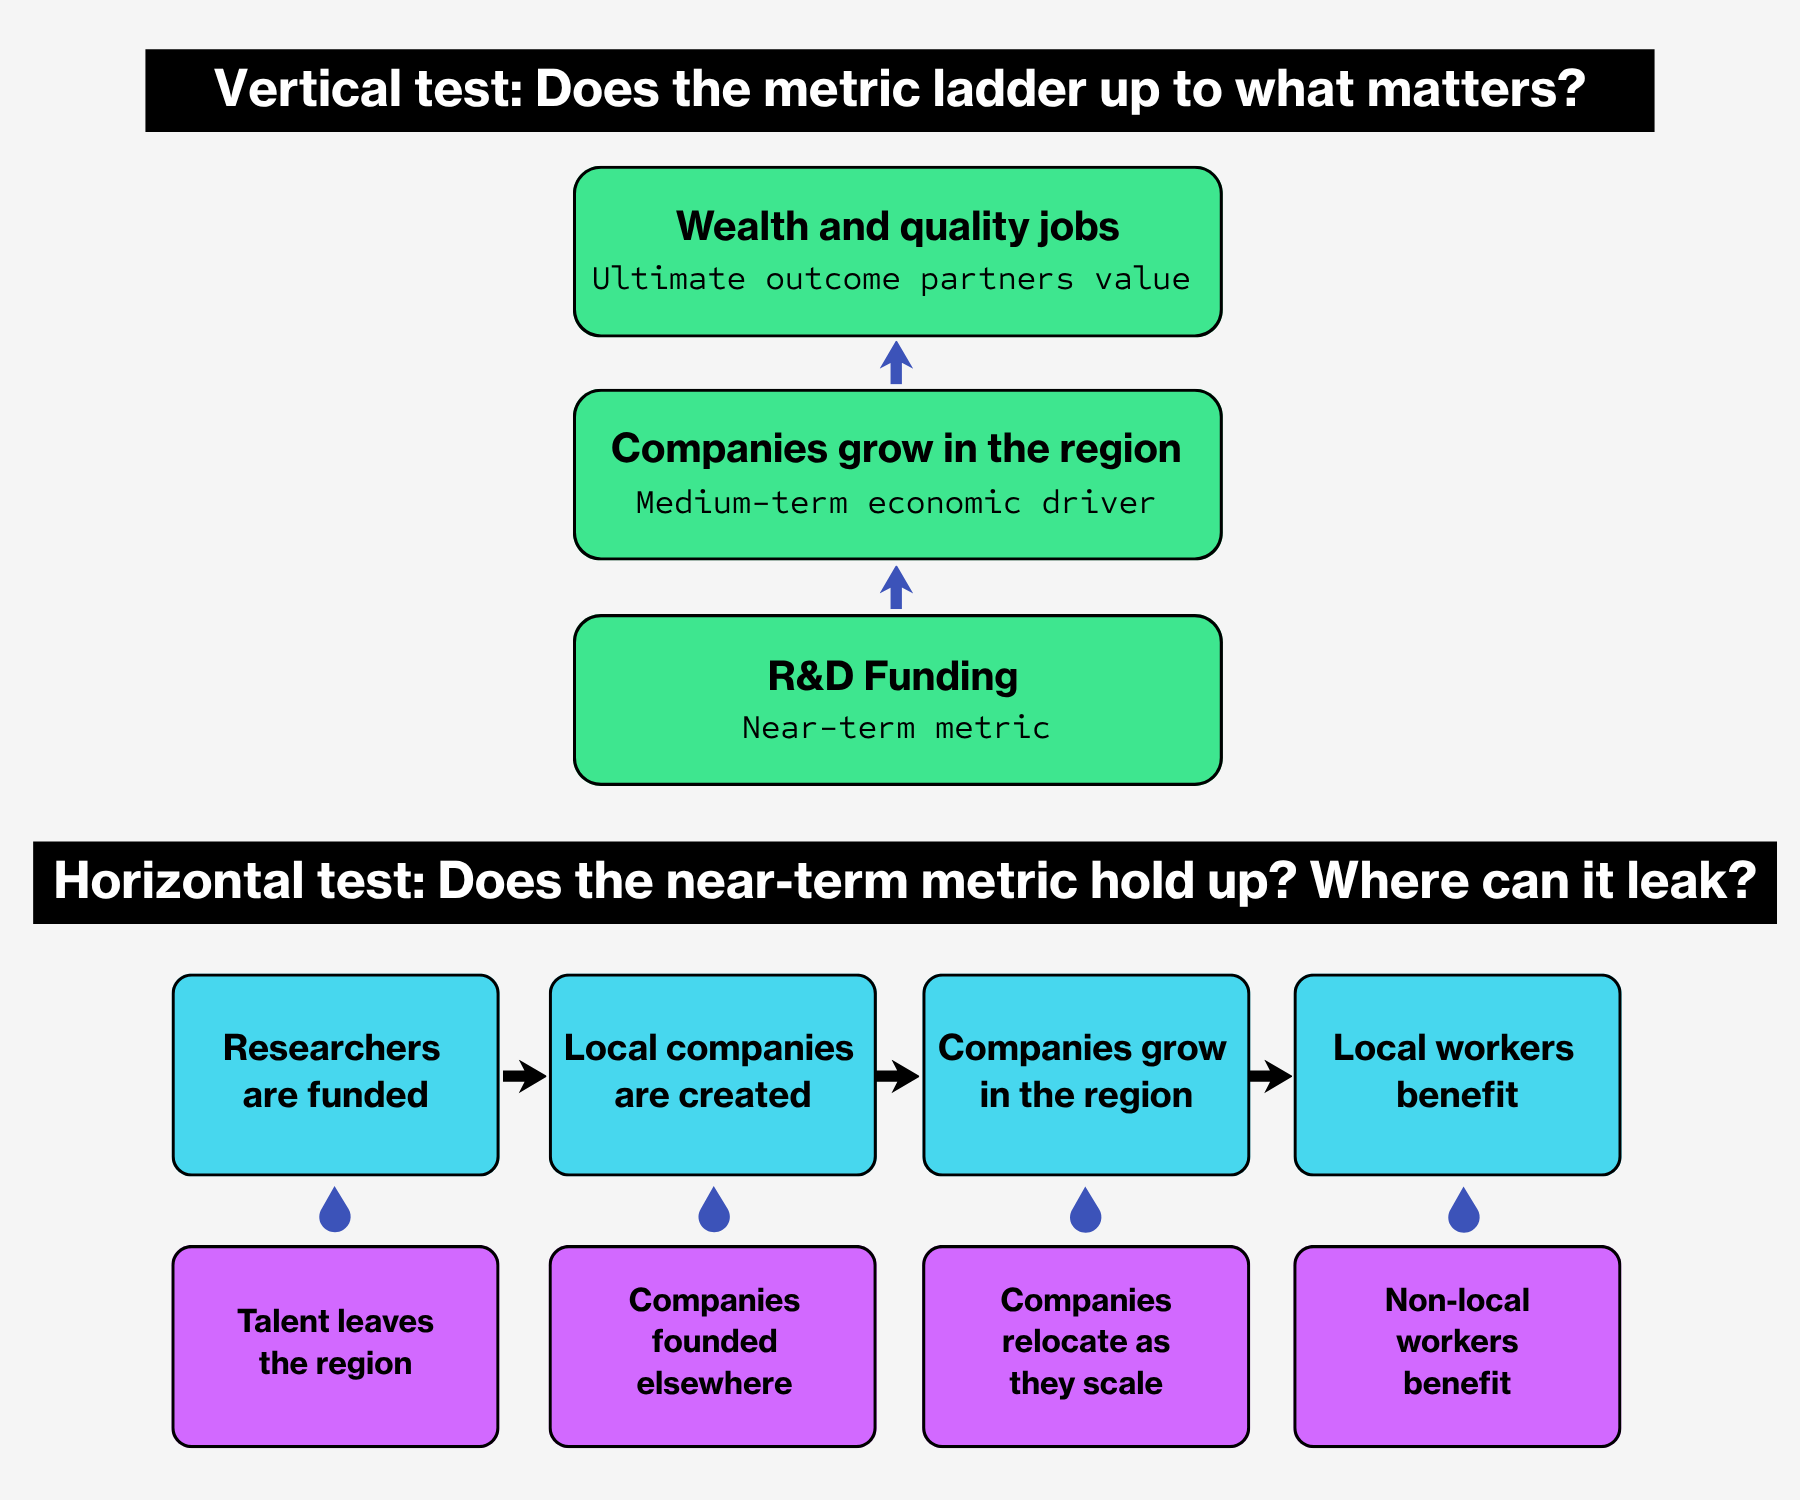
Horizontal Integrity
For any innovation-related metric–say patent production–ecosystem builders should ask themselves what related phenomena that metric is assumed to capture. As a simplified example, if a region elevates R&D funding as a key metric, it likely assumes that students and researchers from the region are benefitting from that funding, and that the funding is leading to the creation of companies, and that those become companies in the region, and those companies grow in the region, and workers from the region benefit.
But this envisioned “pipeline” could have many leaks along the way–it is entirely possible that students from outside the region come, engage in that R&D work, and then leave the region. Potential partners often intuit that these leaks exist even if they cannot pinpoint precisely where or why. And they are not wrong. Research on university-licensed life science startups, for example, found that while many such firms are formally created, a significant share either fail to grow meaningfully or persist as “walking dead” firms — nominally active but making little economic contribution. Other research has found that about 80% of jobs created by business attraction projects go to in-migrants rather than local non-employed people.
Potential partners often intuit that these leaks exist even if they cannot pinpoint where or why. Horizontal integrity means the metrics systems surfaces and monitors each of those potential failure points.
Vertical Integrity
Vertical integrity means that near-term metrics, which might suggest that a certain program or initiative is working, “ladder up” to medium-term metrics, which might suggest whether a key driver of the economic performance is improving. These medium-term metrics should in turn ladder up to a few ultimate outcomes that innovation-related efforts are supposed to create, like wealth creation and job quality.
This way, any innovation-related metric–whose value might seem obvious to someone close to the innovation system, but might be lost on a workforce development practitioner or community foundation–can be articulated as a critical input to, for example, a more productive economy and ultimately higher-quality jobs.
The bottom line: metrics can be a way to demonstrate to potential partners that seemingly esoteric innovation-related efforts are, in fact, designed to ultimately yield the same outcomes as other economic and workforce development efforts – and that innovation ecosystem-builders have put in place mechanisms to ensure that is actually happening (rather than local R&D funding turning into wealth for founders and venture capitalists in other cities, for example).
Once a baseline is set and metrics are arranged in the right structure, ecosystem builders can define, for each metric, what plausible amount of progress is over 10 years. Doing this in a reasonably methodical way can generate buy-in and shape investment.
In terms of buy-in, if ecosystem builders can describe not just what metrics it hopes to improve but by how much, it can illustrate what kind of progress is at stake for potential partners that don’t have a reference point for what a successful commercialization effort looks like.
In terms of shaping investment decisions, a methodical approach to defining potential progress allows regions not to over-spend where there are diminishing returns or underspend where there is high upside (in other words, low-hanging fruit). Imagine, for example, a region that is measuring its success by patenting rates and venture capital funding. If the region is only at the 20th percentile compared to peer regions on the first of those metrics, but at the 90th percentile on the second, ecosystem builders can set the expectation that it will likely (and should likely) make much more significant progress on the first and only incremental progress on the second. And it can help the team ensure that it is not allocating inordinate funding to the second while neglecting the first.
These benefits hinge, of course, on accurately identifying a plausible amount of progress. In terms of buy-in, partners may be disinterested if goals seem too small at the outset, but they may struggle to stay engaged if goals seem too large a few years in. And in terms of strategic investment decisions, those 20th percentile and 90th percentile figures have to be accurate and meaningful. Identifying these plausible-but-ambitious goals is more art than science, but one approach is for a region to aim to match the standard of its best peer region (as of today) in 10 years. Assuming peers are chosen carefully, there is usually no reason why this would be clearly implausible. After identifying these gaps, ecosystem builders can also look at their current trajectory–if they are already close to their best peer and on a long-term upward trajectory, they may choose a point further in the distance (and vice versa).
Setting these sorts of goals can shape strategy in two ways that are deeper than allocating funding to the right general areas. First, these goals can inform risk tolerance – if a region is far from the frontier and not improving, and the evidence base on what works is inconclusive, then a region might consider trying something novel and patiently allowing the experiment to bear fruit. If a region is moving steadily toward the frontier and the evidence base is clear, it might instead decide to commit to scaling established best practices. Second, these goals can inform the creation of multi-organizational teams and accountability within them. Here, turning goals into absolute numbers is important. If a region seeks to create 200 more startups of a certain type over 10 years, it can assemble a group of organizations that today collectively support 100 such startups and distribute across that group the work of supporting 100 more. With this type of number at hand, the convener of the group can relatively easily monitor which organizations are upholding their commitment, which are underperforming, and which merit more support.
.png)
The Key to Using Metrics to Mobilize a Coalition
If NSF Engine teams and similar intermediary “hub” organizations are to attract the commitment of regional partners that will enable their long-term success, their metrics need to not only answer “does the Engine work” but also, “does it matter whether it’s working”?
Few potential partners will ask this question so directly. But they are exposed to a constant stream of competing data points–from national economic news to local nonprofits touting the success of their own programs to economic development organizations announcing new business attraction projects. Amid this flurry, it is difficult to evaluate the work of an intermediary hub like the NSF Engines – are 10 new startups in a key sector more important than the 1,000 jobs associated with a new manufacturing facility? Are 20 graduates from a new industry-aligned program in an emerging industry more important than 200 graduates from an accounting program?
Metrics need to break through with this audience, convincing potential partners that an NSF Engine or similar coalition is ambitious, is pursuing a goal that transcends typical innovation metrics, and can be counted on to adapt strategy as new information emerges. The three-part framework is one way to turn a measurement system into a tool to support this kind of regional mobilization.